


1. Market Size and Growth Rate
1.1 End-Market Demand Base
Vintage 2025 data from the U.S. Census Bureau report a total U.S. population of 341,784,857, including 269,763,509 people aged 18 and older. Applying the nationwide broad fragrance usage rate of 73%-74% to the adult population yields approximately 196.9 million-199.6 million potential fragrance users. A Collage Group survey shows that, among fragrance users, 50% most prefer spray perfume or cologne; this produces a “core glass-spray consumer proxy” of approximately 98.5 million-99.8 million people. This figure is not a measured share for glass packaging; it is an auditable proxy variable used to build demand scenarios.
| Reason for Using Fragrance | Share of U.S. Fragrance Users | Consumer Psychology |
| To feel clean | 46% | Fragrance serves as a “confirmation of cleanliness” after showering, washing their hair, or applying deodorant. |
| To boost confidence | 38% | It reduces concerns about body odor and personal space, helping people feel more comfortable at work, on dates, and in public. |
| To treat themselves or improve their mood | 35% | Fragrance is a relatively affordable emotional indulgence and an enjoyable daily ritual. |
| To create a signature scent | 33% | A distinctive scent reinforces personal identity and encourages others to associate a particular fragrance with them. |
| To express femininity or masculinity | 29% | Fragrance complements the expression of gender identity, fashion choices, and lifestyle. |
| To feel more attractive or sexy | 22% | It is associated with dating, intimacy, attraction, and confidence in one’s body. |
| To stand out and make an impression | 20% | Fragrance offers an invisible yet noticeable way to differentiate oneself from others. |
| To match the season | 9% | Consumers often prefer fresh scents in summer and woody, vanilla, or amber notes in winter. |
| To evoke memories | 7% | The sense of smell forms strong associations with people, places, and different stages of life. |
According to the College Group (2024), Americans use perfume primarily to make themselves feel cleaner. This is a relatively everyday, long-term, and semi-permanent reason for using perfume or deodorant. This provides strong support for the potential of the related industry chain in the coming years.
1.2 Perfume Retail and Packaging Markets
Grand View Research estimates that the U.S. perfume market reached USD 13.04 billion in 2024, is expected to grow to USD 13.64 billion in 2025, and could reach USD 17.18 billion by 2030, with a CAGR of 4.7% (2025–2030). Premium fragrances dominated the market, accounting for over 61% of retail sales in 2024. However, Circana data shows stronger short-term performance: U.S. prestige fragrance sales grew 12% in 2024, with double-digit unit growth; in 2025, prestige fragrance sales increased 5%, while mass-market fragrance sales grew 15%, with unit sales rising at similar rates.
For packaging, public estimates suggest the U.S. fragrance packaging market was approximately USD 766.4 million in 2024. Globally, the fragrance packaging market is projected to grow from USD 2.9 billion in 2024 to USD 3.9 billion by 2030, representing a CAGR of about 5.0%. The glass packaging segment is expected to grow faster, at approximately 5.9% (Market Glass, 2025). Another forecast for cosmetic and perfumery glass bottles estimates a 4.66% revenue CAGR and 4.44% shipment-volume CAGR from 2025 to 2030 (Mordor Intelligence, 2025).
Based on these sources, this report adopts a 4%–6% annual growth assumption for U.S. perfume glass packaging value and 3%–5% annual growth for physical units. This is a planning range derived from multiple market studies, rather than a single official forecast. Applying a 5% annual growth rate, the U.S. fragrance packaging market could reach approximately USD 1.03 billion by 2030. This figure includes pumps, caps, cartons, and other packaging components, and should not be considered the standalone value of glass bottle procurement, as public data does not provide a reliable separate share for glass bottles in the U.S.
2. Regional Demand and Packaging Opportunities Across the US.
The regional figures below use a uniform penetration rate of 73%-74% to represent the potential end-user population; they are not measured state-level sales. For packaging exporters, regional differences relate mainly to customer density, channels, regulations, climate, and transportation rather than fragrance profiles.
| Region | States/Areas | Potential Users (10,000s) | Packaging Opportunities |
| South Atlantic | DE, FL, GA, MD, NC, SC, VA, WV, DC | 4,078-4,134 | Largest region; hot, humid conditions coexist with urban commuting and tourism. Priorities include heat resistance, low leakage, e-commerce breakage prevention, and gift boxes. |
| Pacific | AK, CA, HI, OR, WA | 3,119-3,162 | Driven by California; regulatory, sustainability, and premium-design requirements are relatively strong, while packaging must also withstand high temperatures, ocean freight, and cold environments. |
| East North Central | IL, IN, MI, OH, WI | 2,751-2,788 | Large mass-market and department-store base; seasonal gift sets, standardized bottle designs, and freeze-thaw/long-haul transport testing are important. |
| Middle Atlantic | NJ, NY, PA | 2,492-2,527 | High-density concentration of premium and niche brands; suitable for extra-flint glass, elaborate decoration, small formats, and discovery sets. |
| West South Central | AR, LA, OK, TX | 2,428-2,461 | Texas provides scale; high-temperature conditions increase requirements for sealing, coatings, and pump compatibility. |
| Mountain | AZ, CO, ID, MT, NV, NM, UT, WY | 1,508-1,529 | Tourism and e-commerce are relatively important; pay attention to UV exposure, pressure changes at high altitude, and long-distance distribution. |
| West North Central | IA, KS, MN, MO, NE, ND, SD | 1,251-1,268 | Dispersed population; standard molds, reasonable MOQs, U.S. inventory, and transport-cost control are more important. |
| East South Central | AL, KY, MS, TN | 1,146-1,162 | Opportunities in mass-market price tiers and regional brands; emphasize cost, lead times, heat resistance, and gift-set support. |
| New England | CT, ME, MA, NH, RI, VT | 919-932 | Smaller in scale, but some markets have high purchasing power; lightweighting, simple design, and sustainability documentation are more valuable. |
Sales priority: Tier 1 targets brands, fillers, and packaging distributors in major states such as California, Texas, Florida, New York, and Pennsylvania. Tier 2 expands to regional hubs including New Jersey, Illinois, Georgia, North Carolina, Ohio, and Washington. Smaller markets are mainly covered through distributors, warehouses, and e-commerce channels.
3. Starting from the U.S. Retail Market (Amazon)
3.1 Market Size and Trends
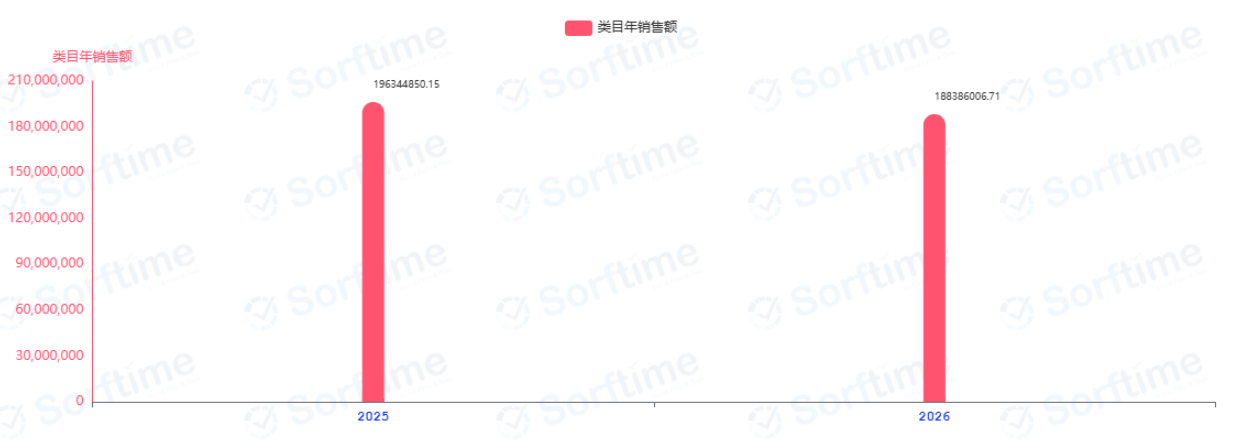
Based on Amazon’s annual market sales, by August 2026, total sales in 2026 had already nearly reached the full-year sales total for 2025.
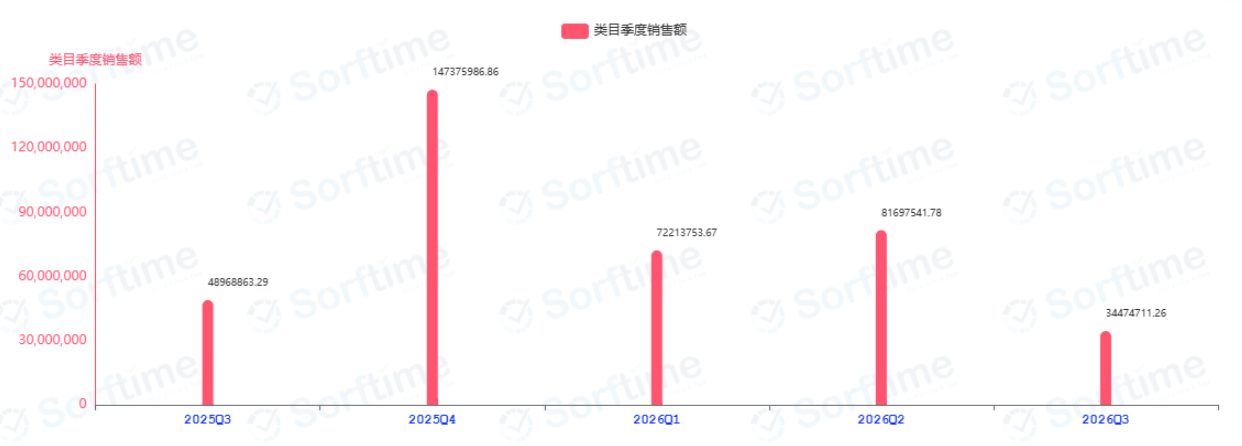
Viewed quarterly, Q4 is the peak sales period for fragrance products. Several major U.S. shopping occasions and holidays – including Prime Day (PD), Christmas, and Halloween – help sales rise rapidly. As a result, total retail sales in 2026 are expected to show strong growth. This is a highly favorable development for B2B exporters.
3.2 Keywords
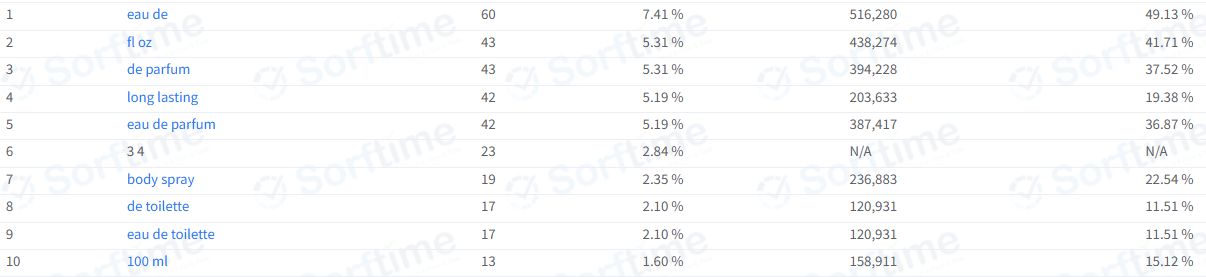
Keyword searches in the U.S. retail market are also dominated by French terms.
- Eau de
- De parfum
- Eau de parfum
- Body spray
- De toilette
- Eau de toilette
For B2B sales, adding French terms can increase the frequency with which an independent website appears in U.S. searches.
3.3 Google Trends
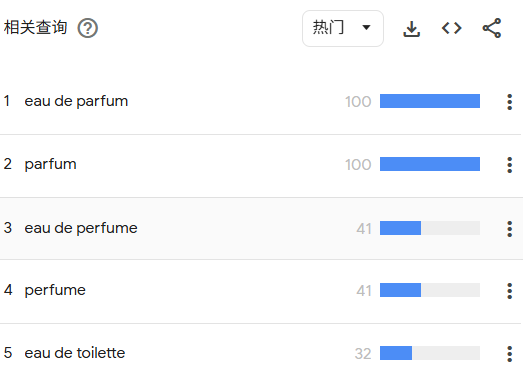
A second verification using Google Trends also shows that searches using French terms exceed those for the English word “perfume.”
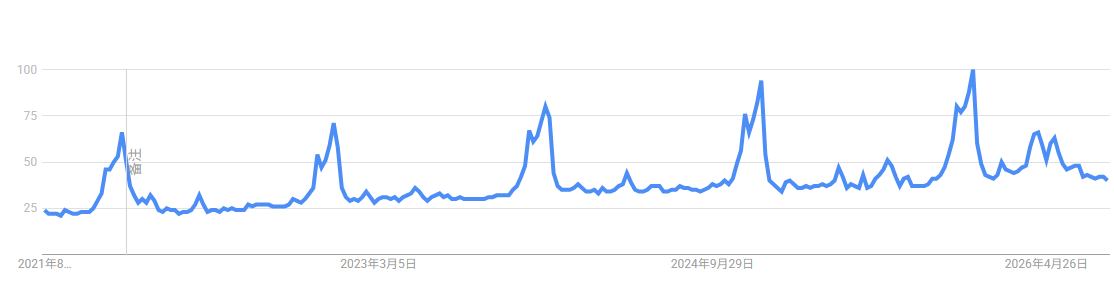
Looking over a longer timeline, searches for “perfume” show a clear upward trend: search volume is generally higher each year than in the previous year and reaches its annual peak around mid-November.